Once a sample is skeleton plotted, the plot is  compared
to an existing dated master chronology to match its pattern of marks in
mirror image and thus find the exact years of formation of all rings.
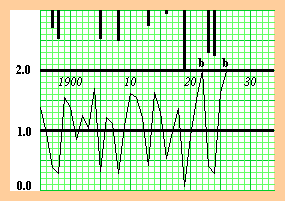
For example, the dated master chronology above is constructed from previously
crossdated samples, it extends from 1885 to 1973, and it has a time series
of standardized growth indices that average 1.0 and that range from 0.0
(very little growth) to 2.0 (maximum growth). <IMG SRC="chronology.gif">
The master is also marked as if it were a skeleton plot, with small indices
represented by long marks and large indices represented by "b" marks.
(For a good idea of how to make marks when skeleton plotting, look at the
master chronology to see what values of ring growth merit a long mark versus
no mark at all versus a "b" mark).
 compared
to an existing dated master chronology to match its pattern of marks in
mirror image and thus find the exact years of formation of all rings.
For example, the dated master chronology above is constructed from previously
crossdated samples, it extends from 1885 to 1973, and it has a time series
of standardized growth indices that average 1.0 and that range from 0.0
(very little growth) to 2.0 (maximum growth). <IMG SRC="chronology.gif">
The master is also marked as if it were a skeleton plot, with small indices
represented by long marks and large indices represented by "b" marks.
(For a good idea of how to make marks when skeleton plotting, look at the
master chronology to see what values of ring growth merit a long mark versus
no mark at all versus a "b" mark).