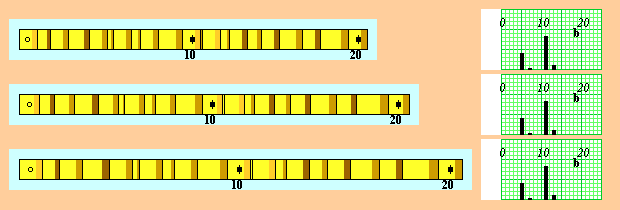

Although trees living within a homogeneous stand or forest usually exhibit the same relative pattern of growth variation through time, they often have absolute growth rates that differ substantially due to living in different microsites. Because of this, it is often difficult to compare the ring-growth variation of two or more specimens from the actual wood samples. For example, all three samples have exactly the same pattern of variation across their 21-year time spans, but the top sample from above has a growth rate less than that of the middle sample, which is less than that of the bottom sample. Because of their differing growth rates, it is impossible to align the common pattern of variation using the actual wood samples. To overcome this situation, dendrochronologists make skeleton plots, i.e., they represent growth variation of samples onto separate strips of standard graph paper in order to equalize the absolute scales ring growth to more easily compare growth variation of two or more specimens. Note that the three skeleton plots above, representing their respective samples, have the same relative scale and are easy to compare to one another. The skeleton plots clearly show that the pattern of variation of each sample is the same (e.g., ring #1 is moderately narrow, #4 is somewhat narrow, #14 is very narrow, #18 is wide) and therefore is contemporaneous.
